Our goal is to provide you with all of the information you need to make informed strategic decisions about your marketing activities. With that in mind, we are proud to present the new Analytics Overview page.
Why should the new Analytics Overview interest me?
As an advertiser or a platform owner, the new Analytics Overview page provides you with the holistic overview of your tracked marketing activities across all channels and devices.
We’ve enhanced the Analytics Overview page with three views by Channel or Device, so that you can better analyse:
- the performance of your marketing channels (Over time view)
- the makeup of your marketing mix (Composition view)
- the volatility within your marketing channels (Ranges view)
You are able to customize the graph by selecting from a range of KPIs and chart types to visualize the data you want to see. Furthermore, you can view data from multiple Advertisers at the same time, instead of just one at a time.
How does it look now?
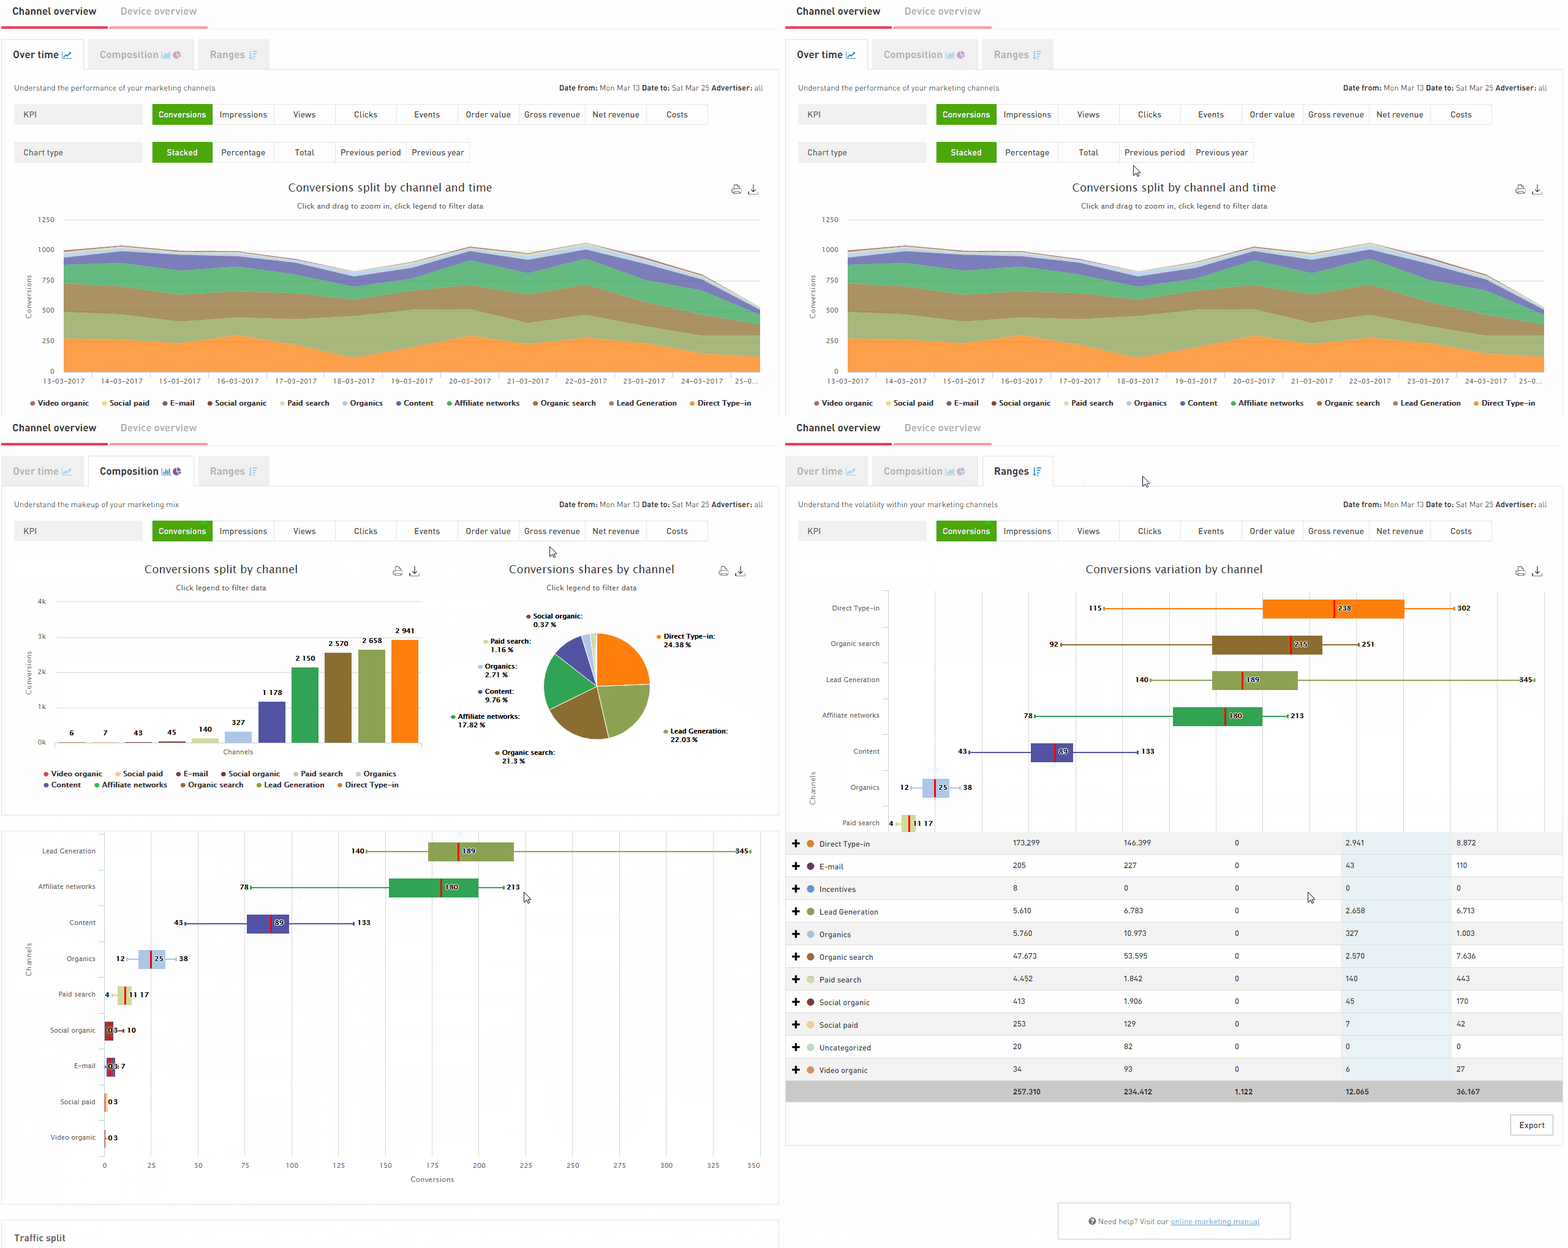
Analytics Overview is now split into Channel Overview and Device Overview. Each of these overviews have three charts each: 1) Over time, 2) Composition, 3) Ranges. Each of these graphs serve a different purpose in analysing how your marketing activities have performed.
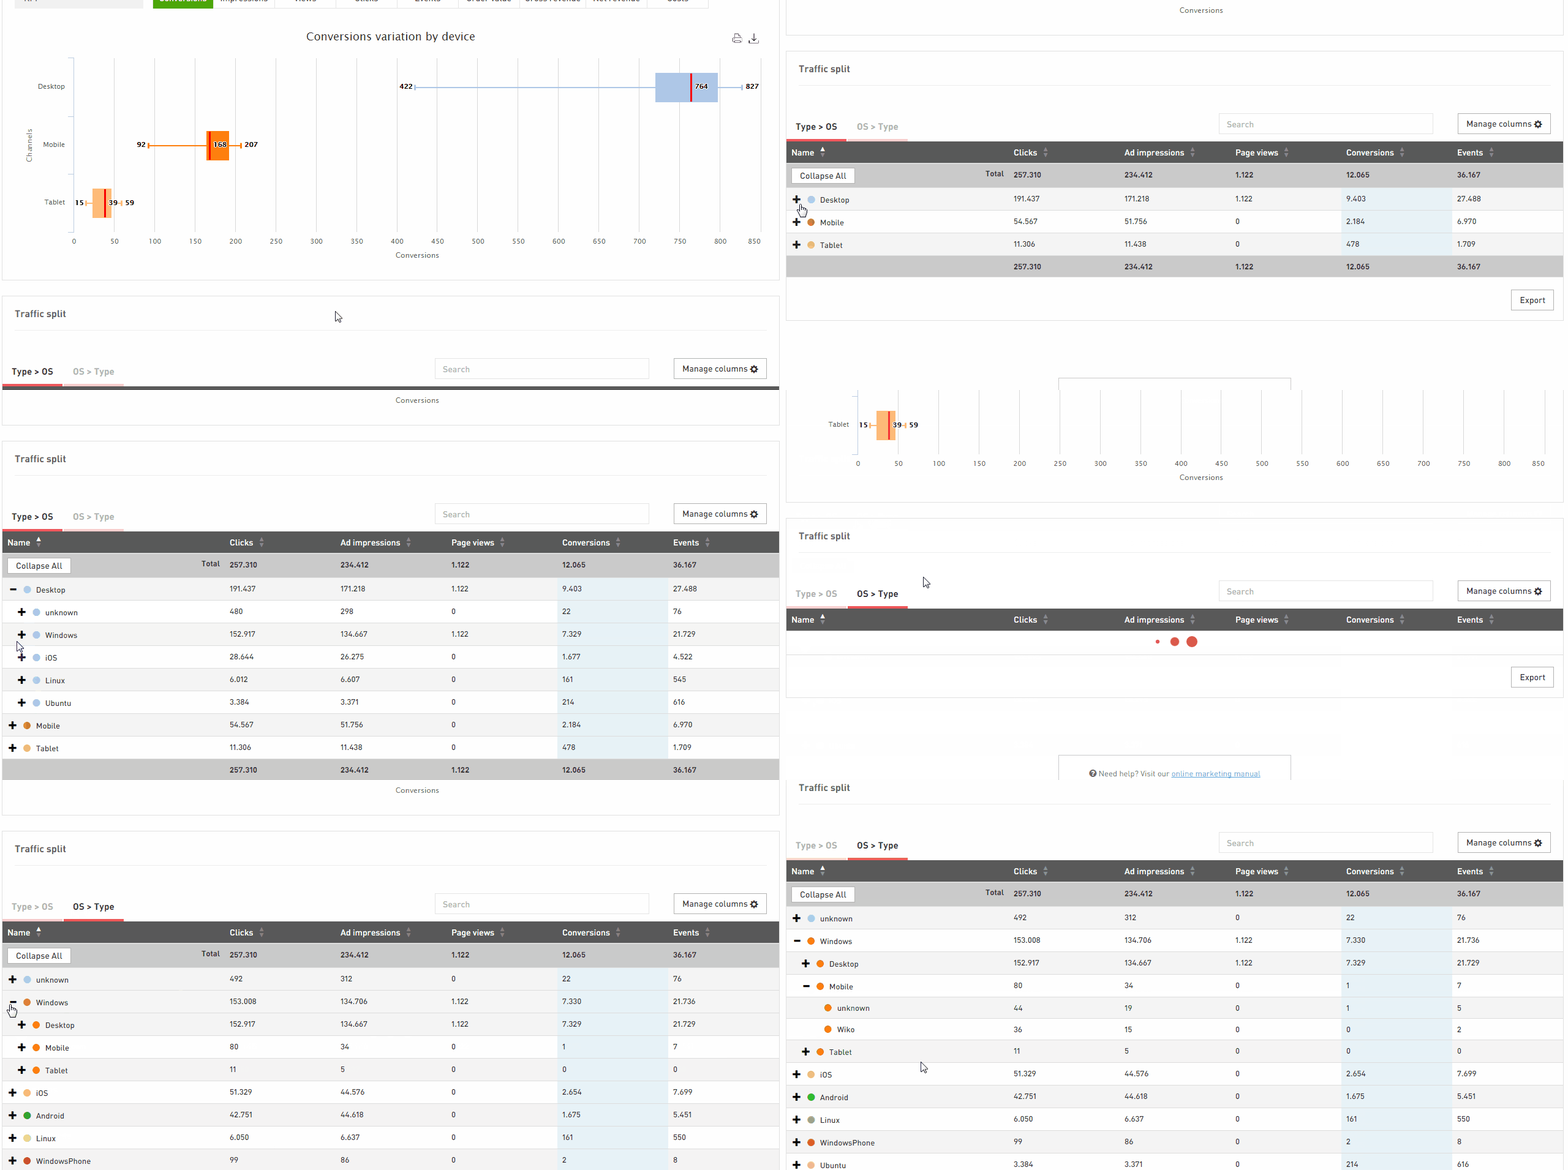
The table at the bottom of each Overview page provides the complete numerical data, with some additional data options available in the “Manage columns” button.
This is what Channel Overview looks like:
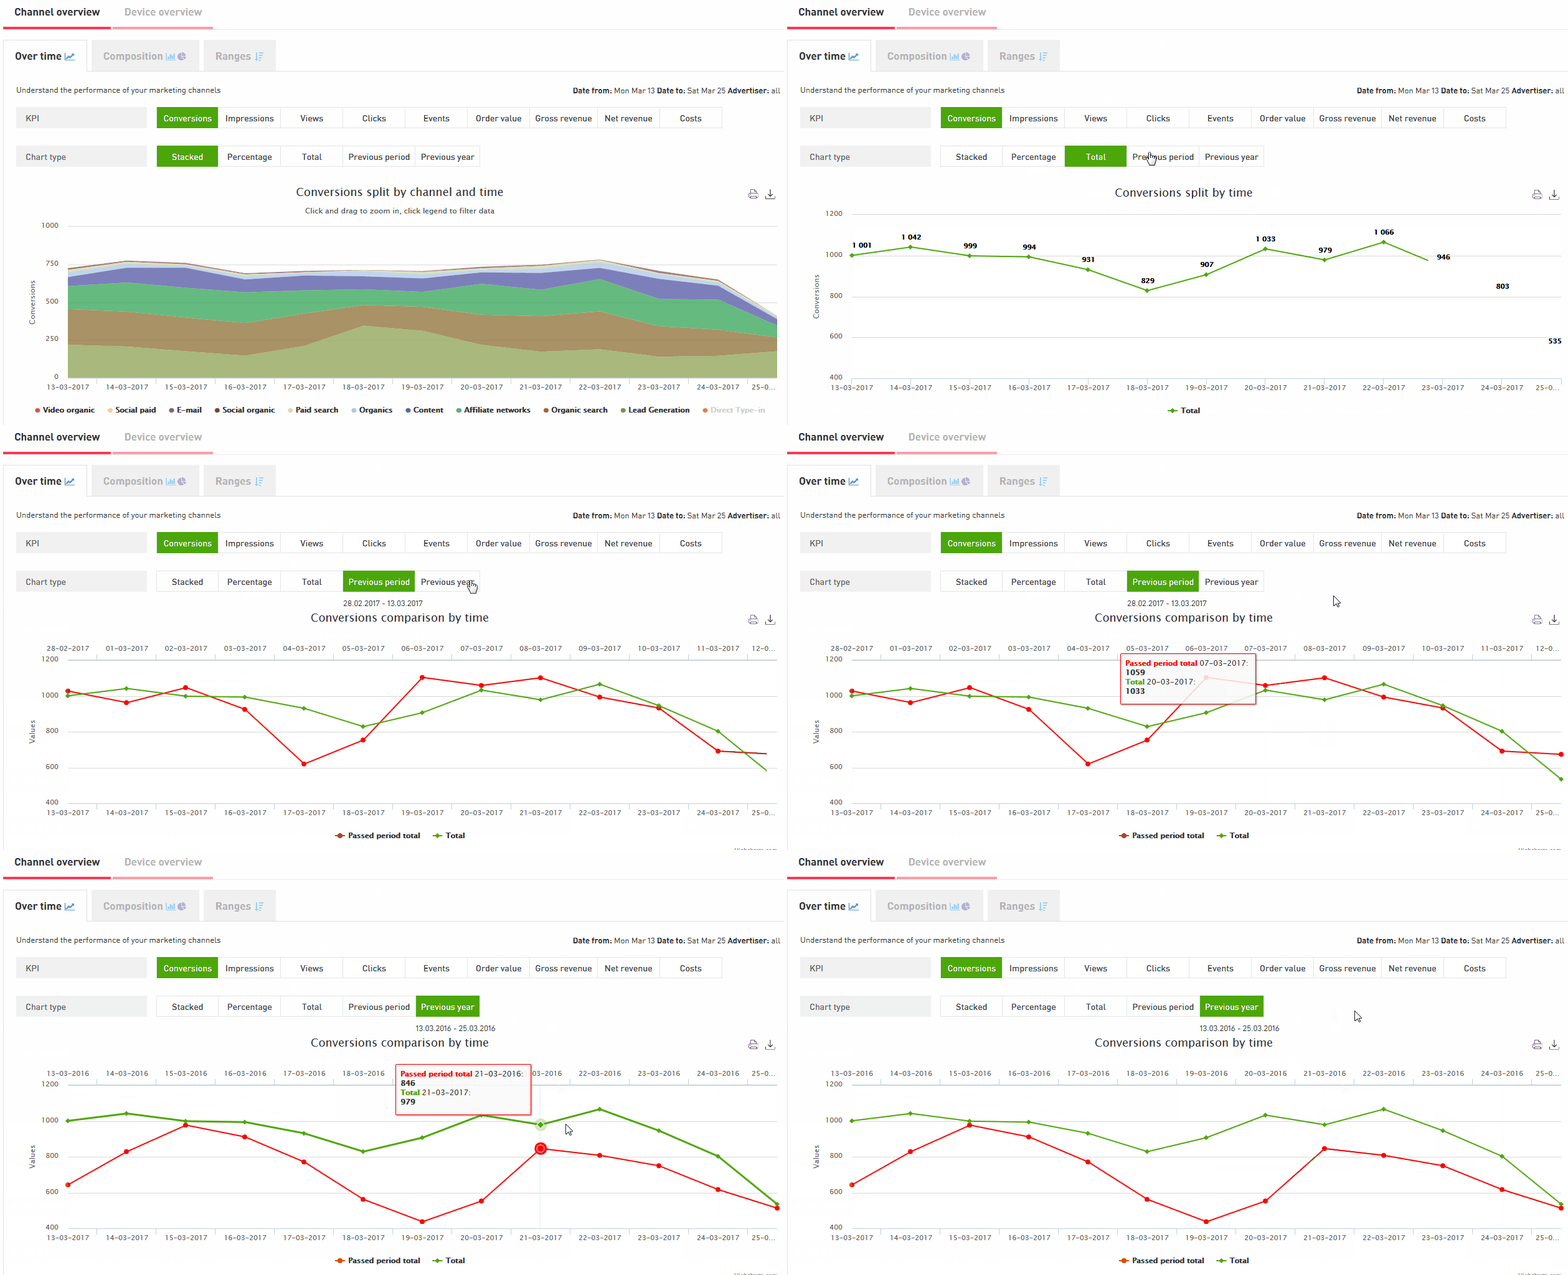
Within each chart, you will be able to select a different chart type, visualising the data in different formats, e.g. stacked or as a percentage. You can also compare this data with the previous period or the previous year, so you have a better insight into how it has evolved over time.
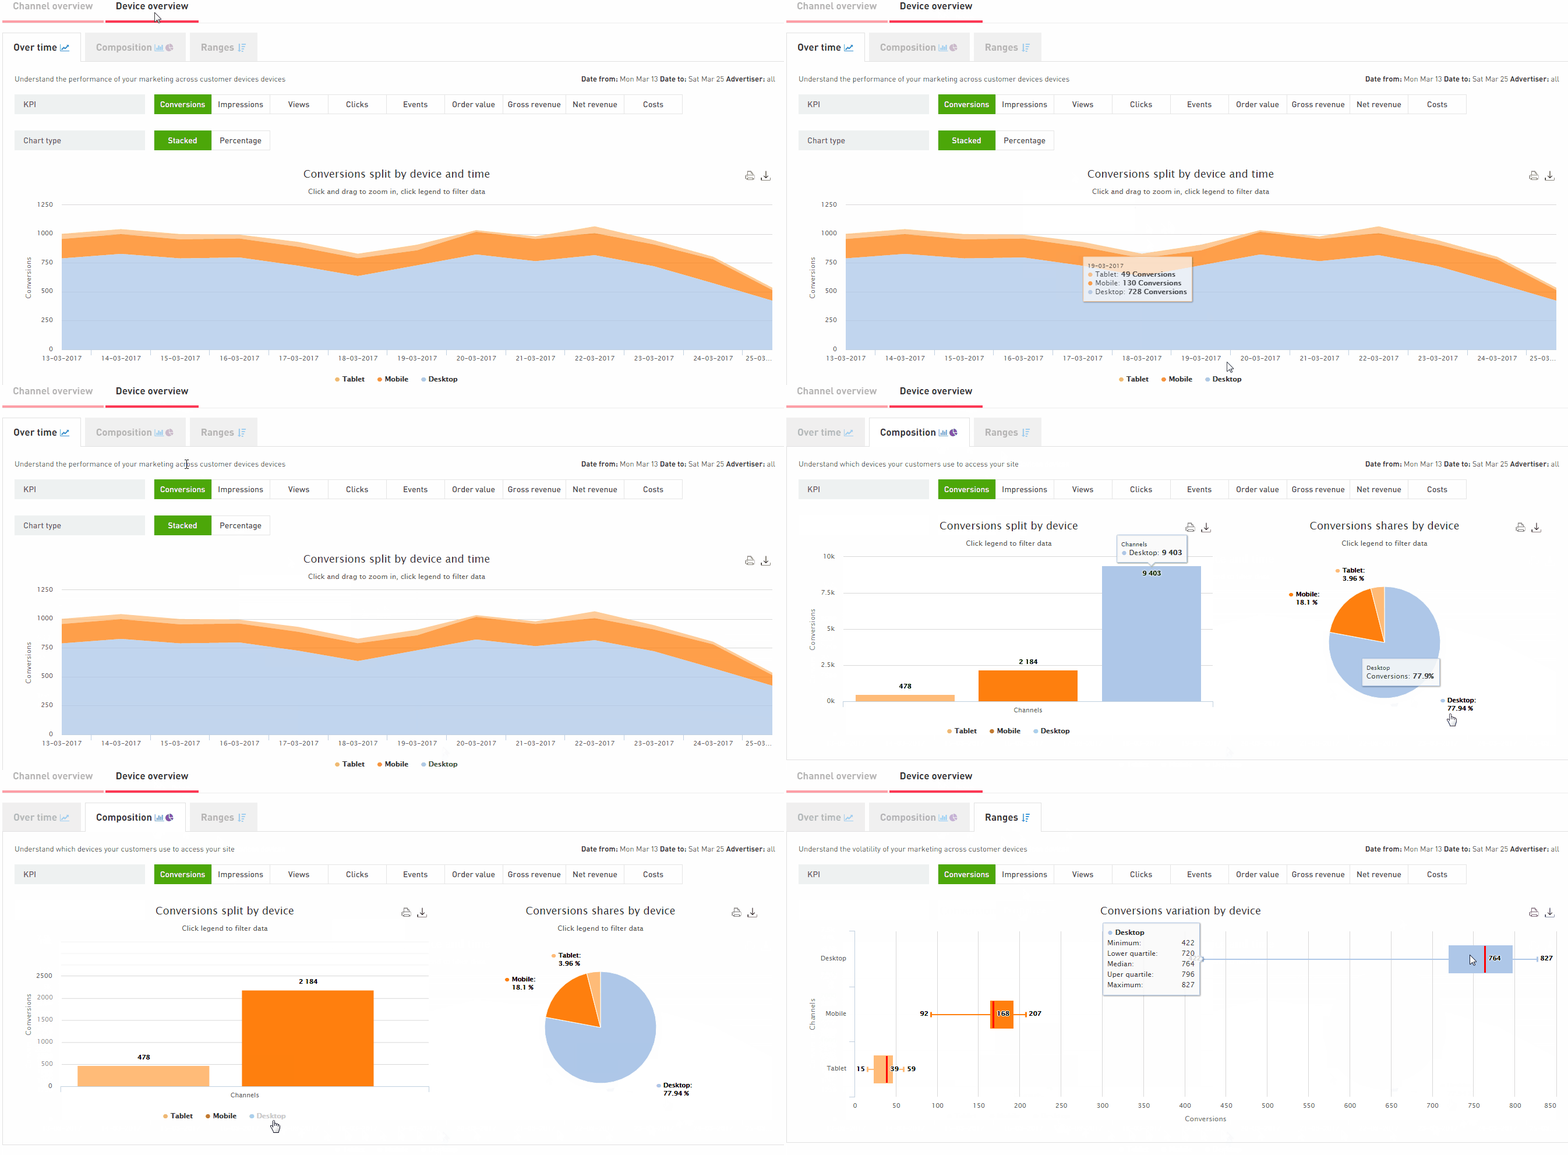
Device Overview provides the same charts but with a focus on the devices involved. If you choose the conversions KPI, for example, then you will be shown how many conversions have been generated across the different types of devices. As before, you are able to select and filter the devices that you wish to display in your graphs.
The data table of the Device Overview has an additional feature enabling you to select your data by type or by OS, depending on which view is more important for you.


